Where Central Asia should look for groundwater.
A knowledge-driven index of relative groundwater favorability for the Fergana Valley — built from open satellite data, and honest about its limits. It maps where conditions are more favorable. It does not locate water.
8 factors · ~51,300 km² at 200 m · open data via Google Earth Engine
The opportunity
Central Asia is drying — and almost no one has mapped its groundwater favorability.
Across arid Central Asia, water stress is rising and surface supplies are shrinking, yet systematic, region-wide assessments of groundwater favorability are still almost absent — the first peer-reviewed study of its kind in the region appeared only in 2025 (Akbakay, Kazakhstan). Where assessments do exist, they are largely manual: a specialist hand-digitizes geological sheets and weighs factors by hand, one region at a time. That manual-mapping bottleneck is exactly what an open-data pipeline can relieve.
The Fergana Valley is a paradox. It is the best-documented basin in Uzbekistan — and there, the problem is often not too little water but too much shallow water: waterlogging, rising water tables, and salinization. So a favorability map here is a perfect honesty test: a physically favorable zone can still hold saline or shallow, problem water. Favorability is not the same as good water — and our map says so.
- 2025
- first peer-reviewed groundwater-favorability study for Central Asia — the niche is effectively open
- ~51,300 km²
- Fergana Valley pilot, assessed at 200 m resolution from open satellite data
Read this first
What Aquanium is — and what it is not.
It is
- A knowledge-driven, relative groundwater-favorability index — a weighted overlay of open satellite factors.
- A concept demonstrator of a working pipeline: open data → factors → weighted map → web UI.
- An honesty-first tool with a built-in robustness layer that shows where the map is stable and where it depends on our weight choices.
- A method and platform — the proven Morfo Labs stack (from minerals) applied to groundwater, with an explicit roadmap to a validated model.
It is not
- Not a yield or flow prediction, and not a “drill here” recommendation.
- Not a water-quality or potability map — a favorable zone can still be saline or brackish.
- Not a trained / ML / AI model — the weights come from published literature, not from data. It is an expert hypothesis, not an empirical forecast.
- Not complete: the dominant control on this aquifer — lithology (the alluvial-aquifer geology) — is not yet included and is flagged throughout.
The method
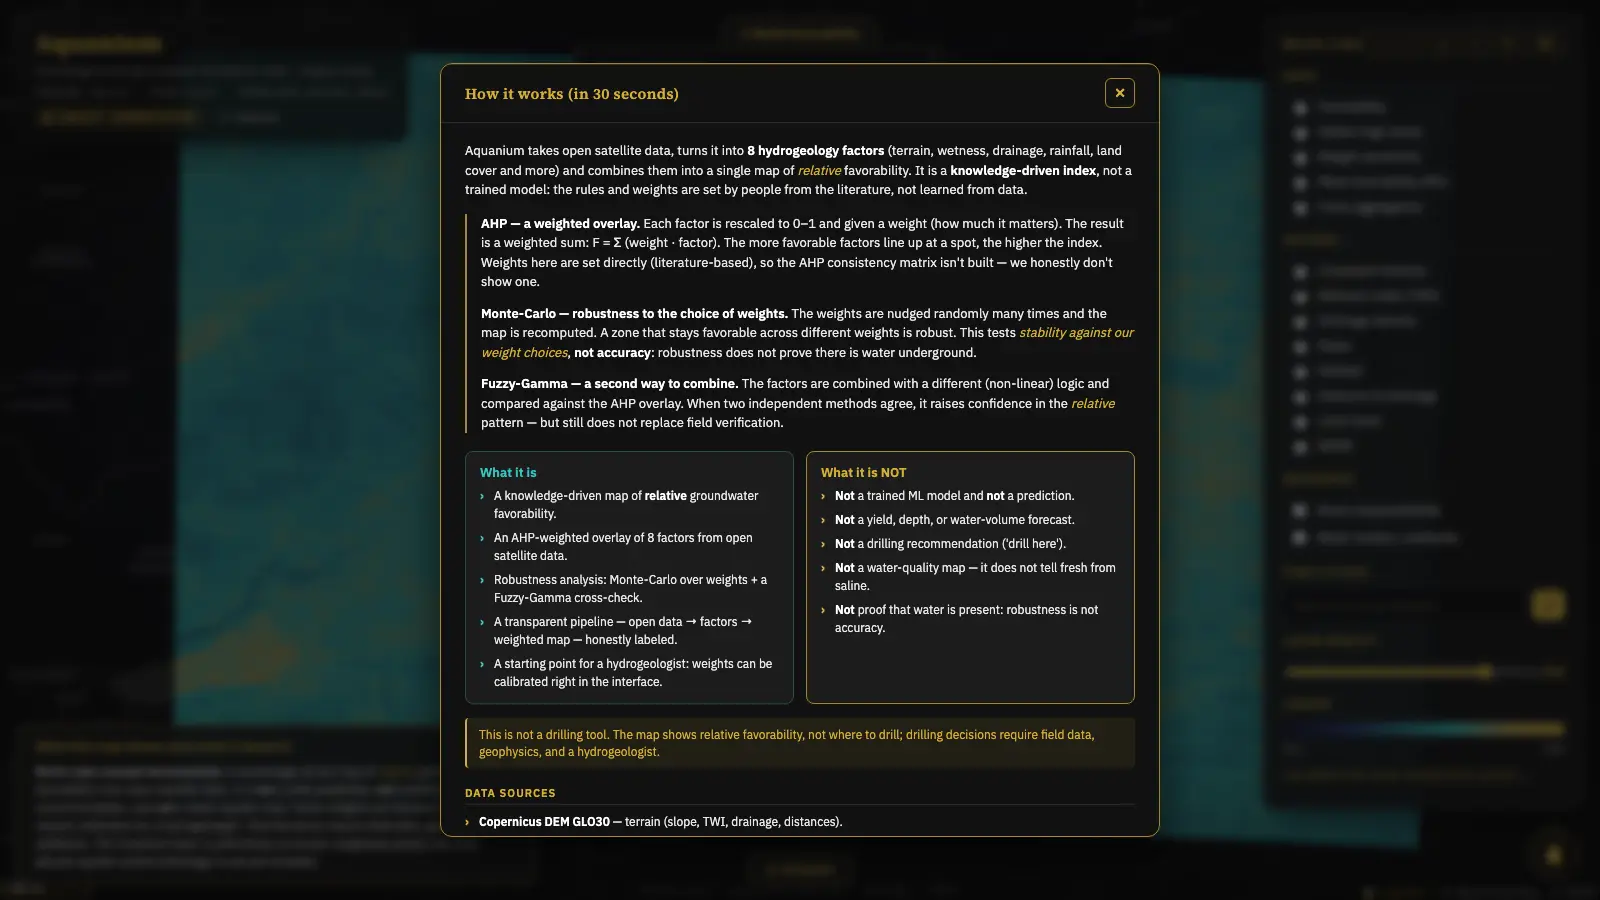
Open satellite data → 8 factors → an AHP-weighted overlay → favorability + robustness.
Every heavy computation runs server-side in Google Earth Engine. We pull open satellite layers, derive eight hydrogeological factors, normalize each one by its hydrogeological meaning, and combine them as a weighted sum using starting weights drawn from the arid-region literature. Then — and this is the honest core — we stress-test the weights with a Monte-Carlo run (±10%) and a Fuzzy-Gamma aggregation, so the map can show where it is sure and where it is only guessing about weights.
- 01
Open satellite data
Pull open layers server-side in Google Earth Engine — no heavy computation in the browser.
- 02
8 hydrogeological factors
Derive each factor and normalize it by its hydrogeological meaning (categorical layers stay nearest-neighbour).
- 03
AHP-weighted overlay
Combine the factors as a weighted sum using starting weights drawn from the arid-region literature.
- 04
Favorability + robustness
Stress-test the weights with a Monte-Carlo run (±10%) and Fuzzy-Gamma — so the map shows where it is sure and where it only guesses about weights.
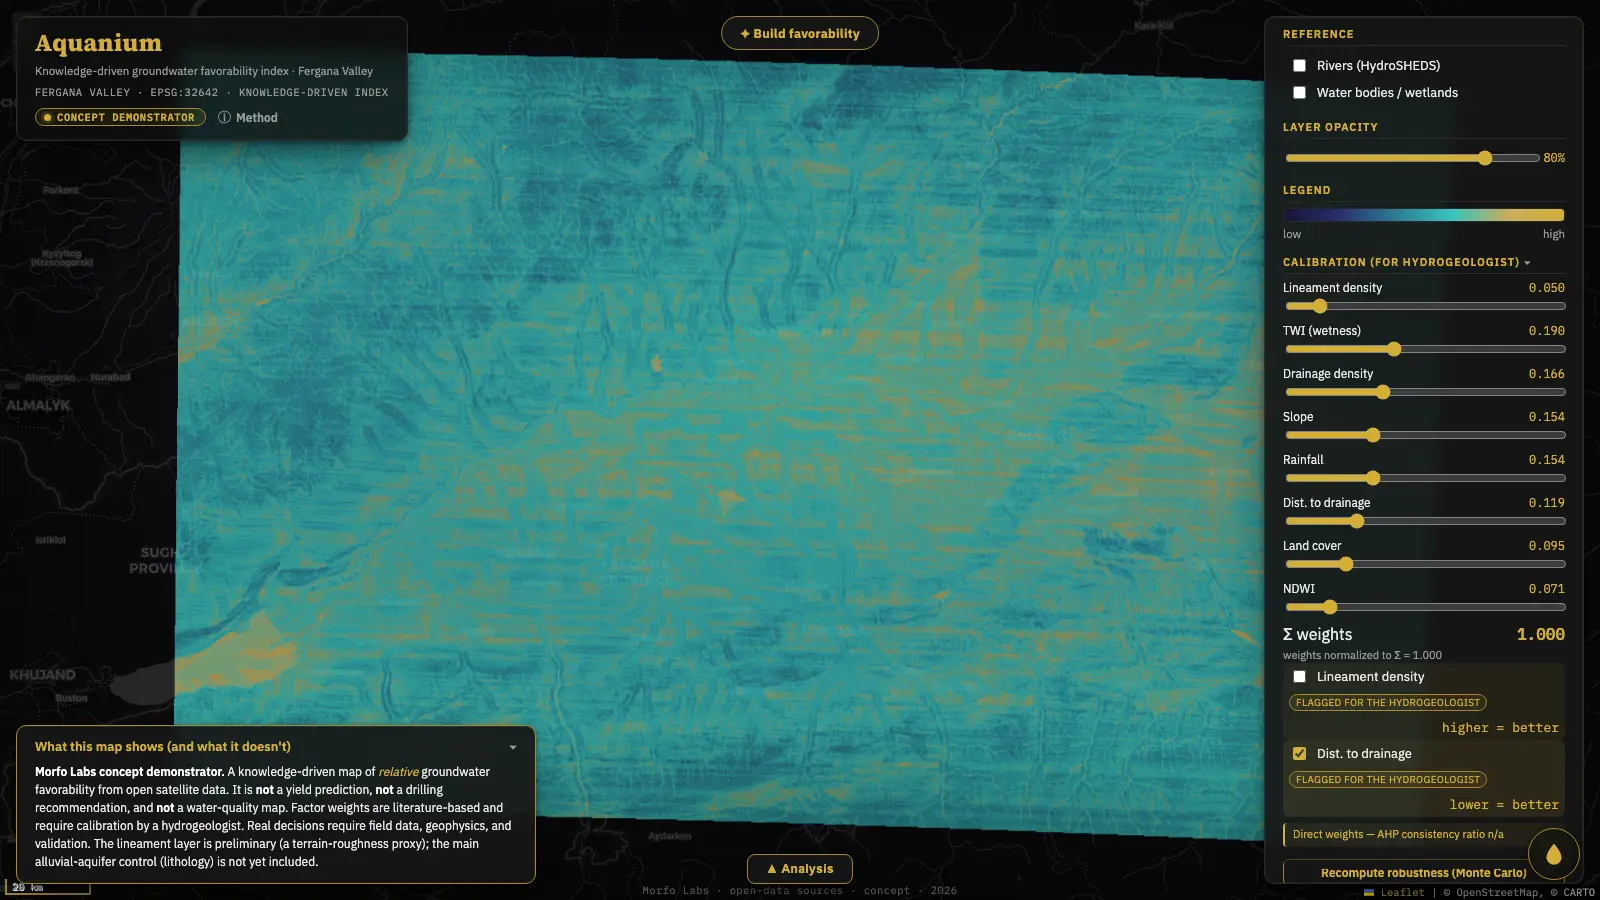
The 8 factors and their starting weights
Σ = 1.00These are literature-informed starting weights, not locally calibrated values. A hydrogeologist must review and adapt them. In the live app you can drag every weight yourself and watch the map and the area-by-class breakdown recompute.

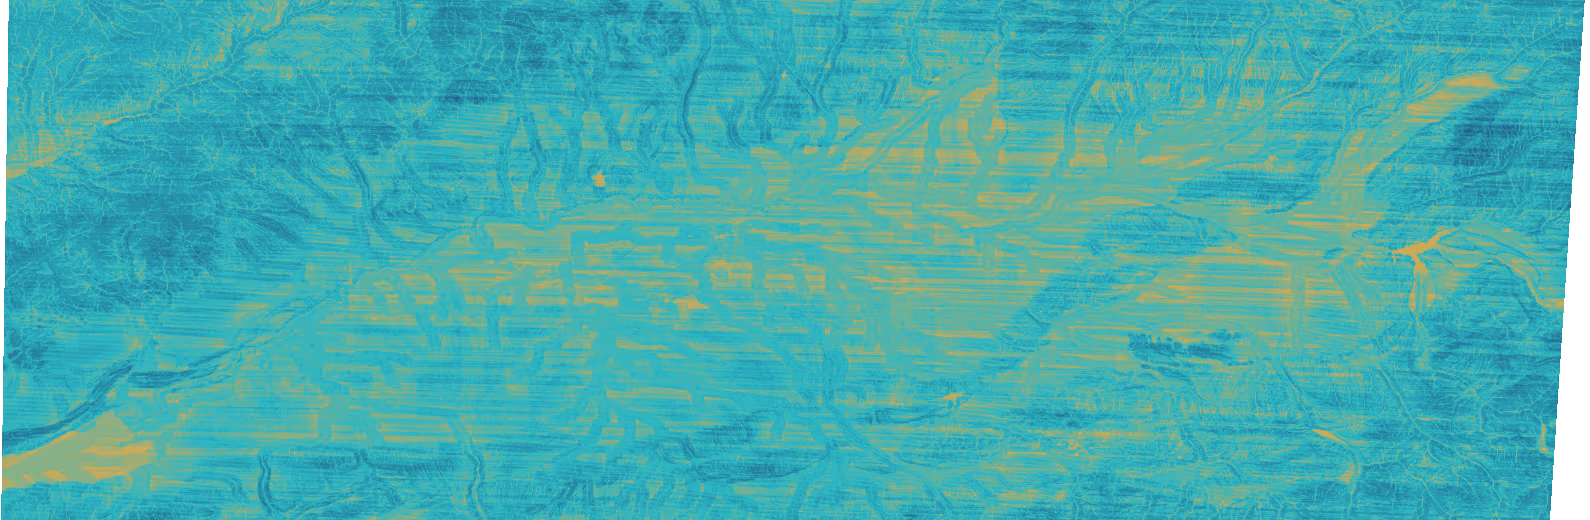
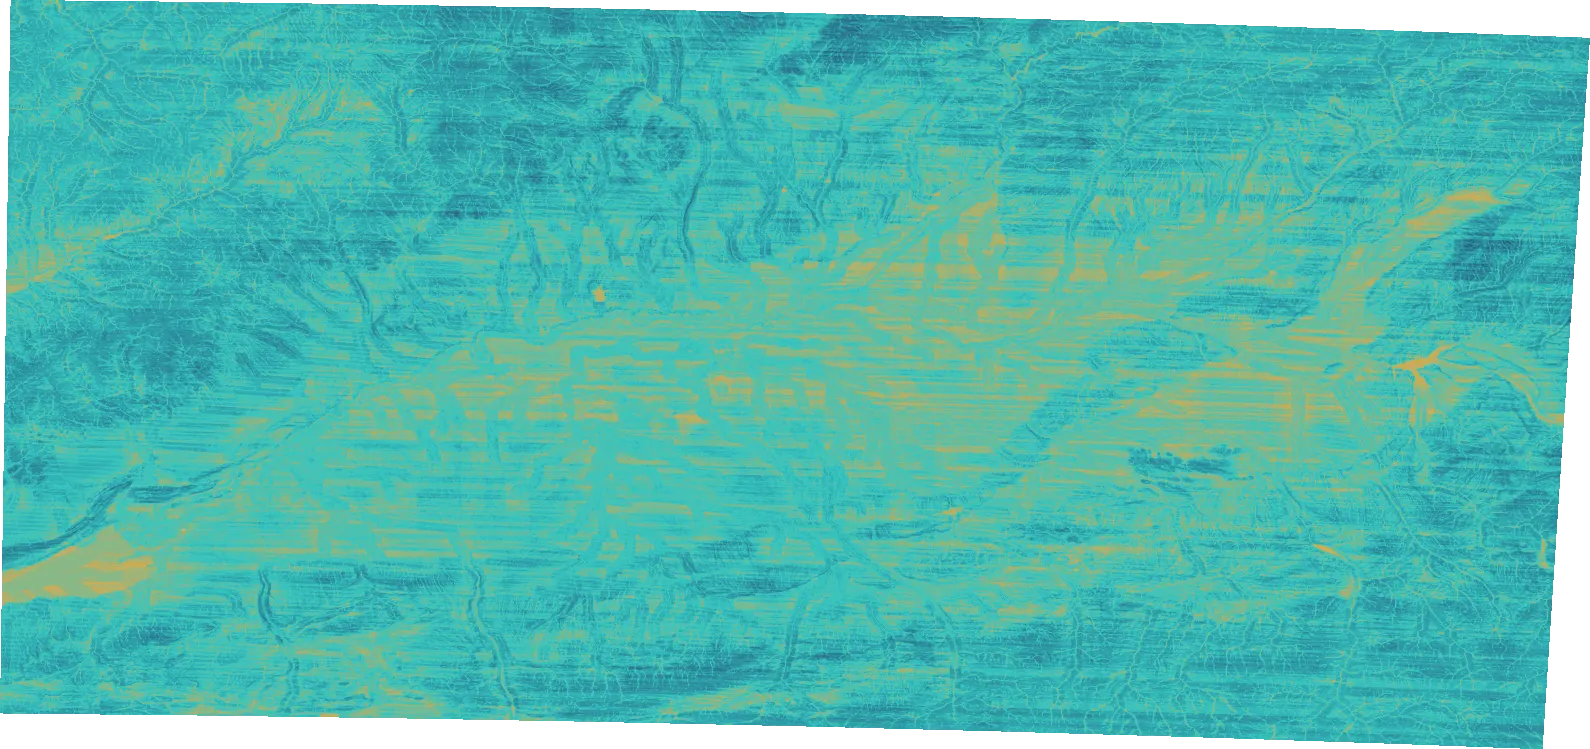
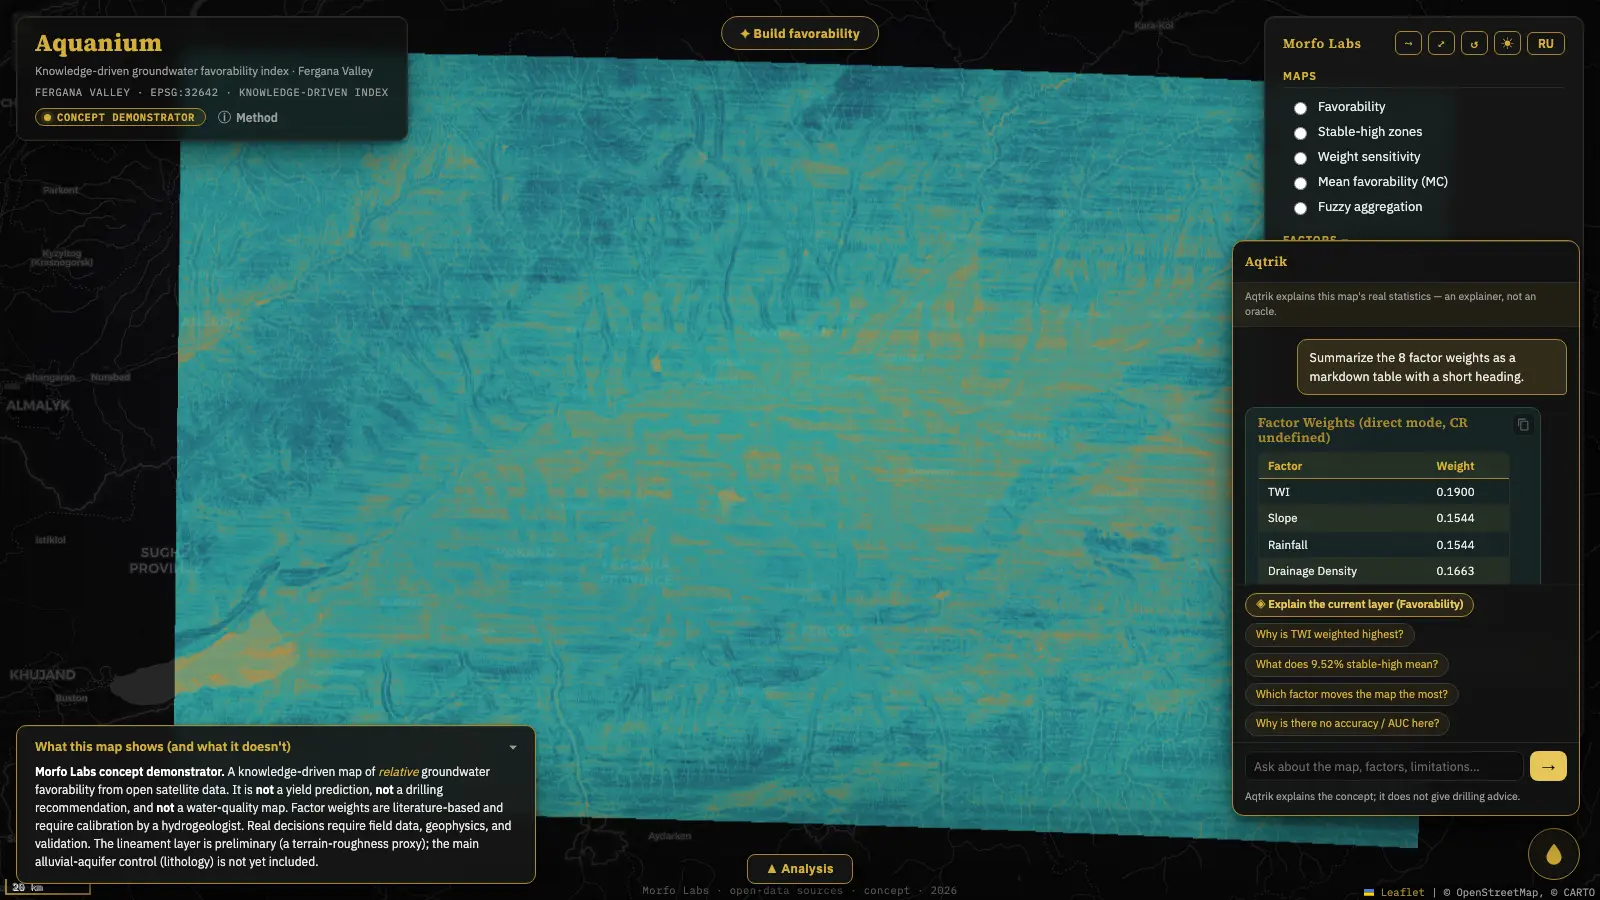
The visualization above shows the AHP weighted-overlay method building step by step: open data → 8 weighted factors → a composited relative-favorability surface. It is not “AI scanning the ground” and not water being found in real time. It produces a relative favorability index — not a drilling recommendation and not a yield estimate.
Not a mockup
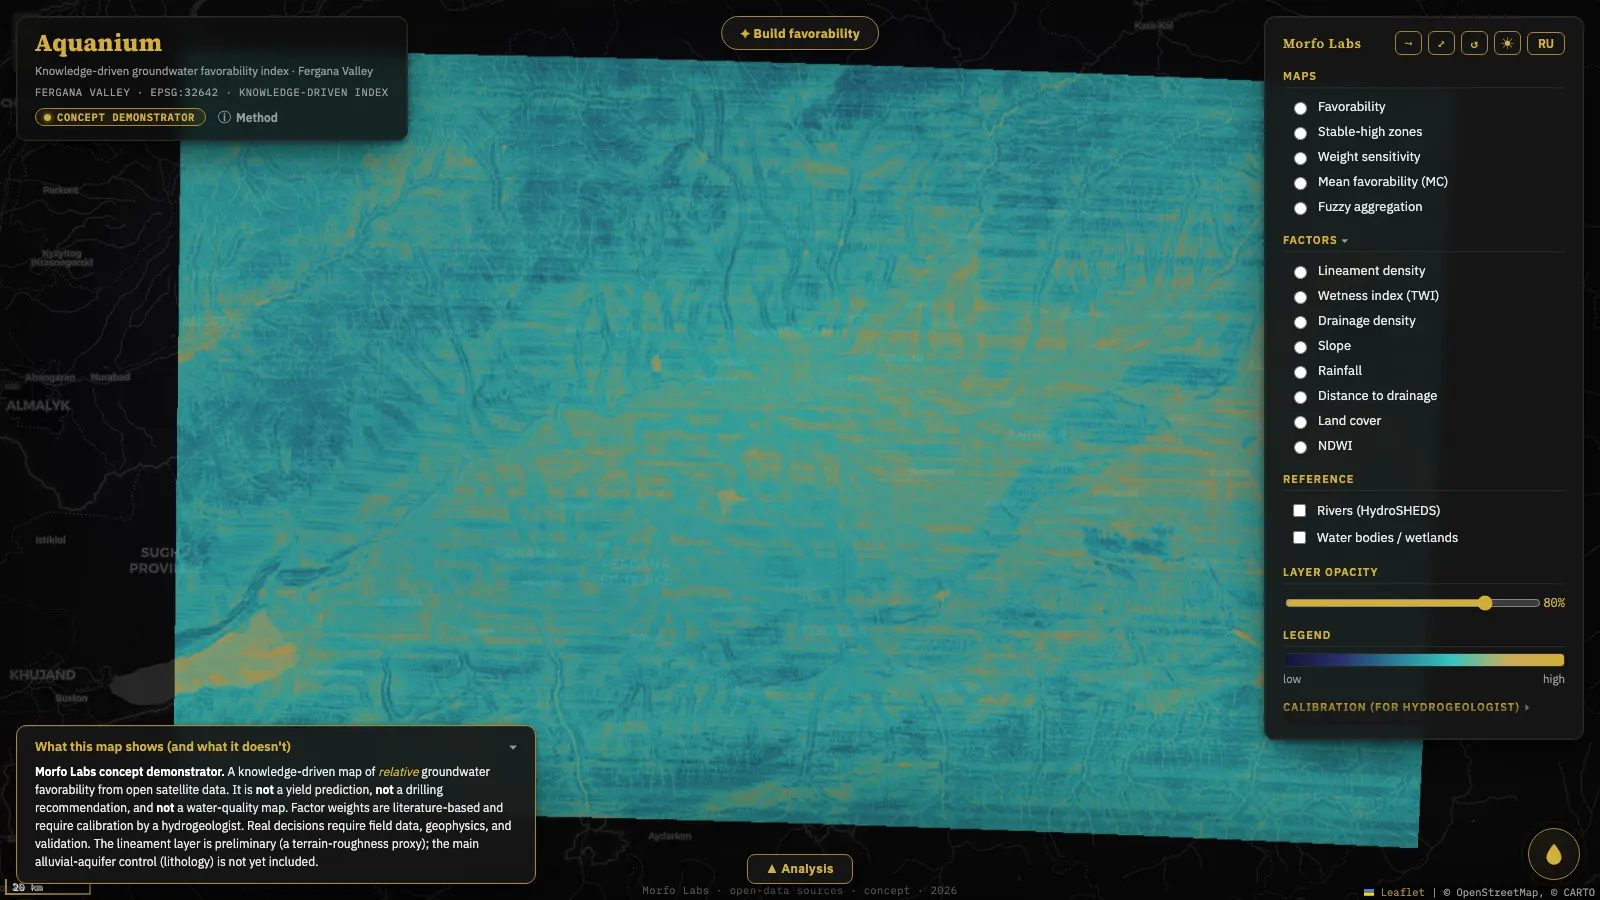
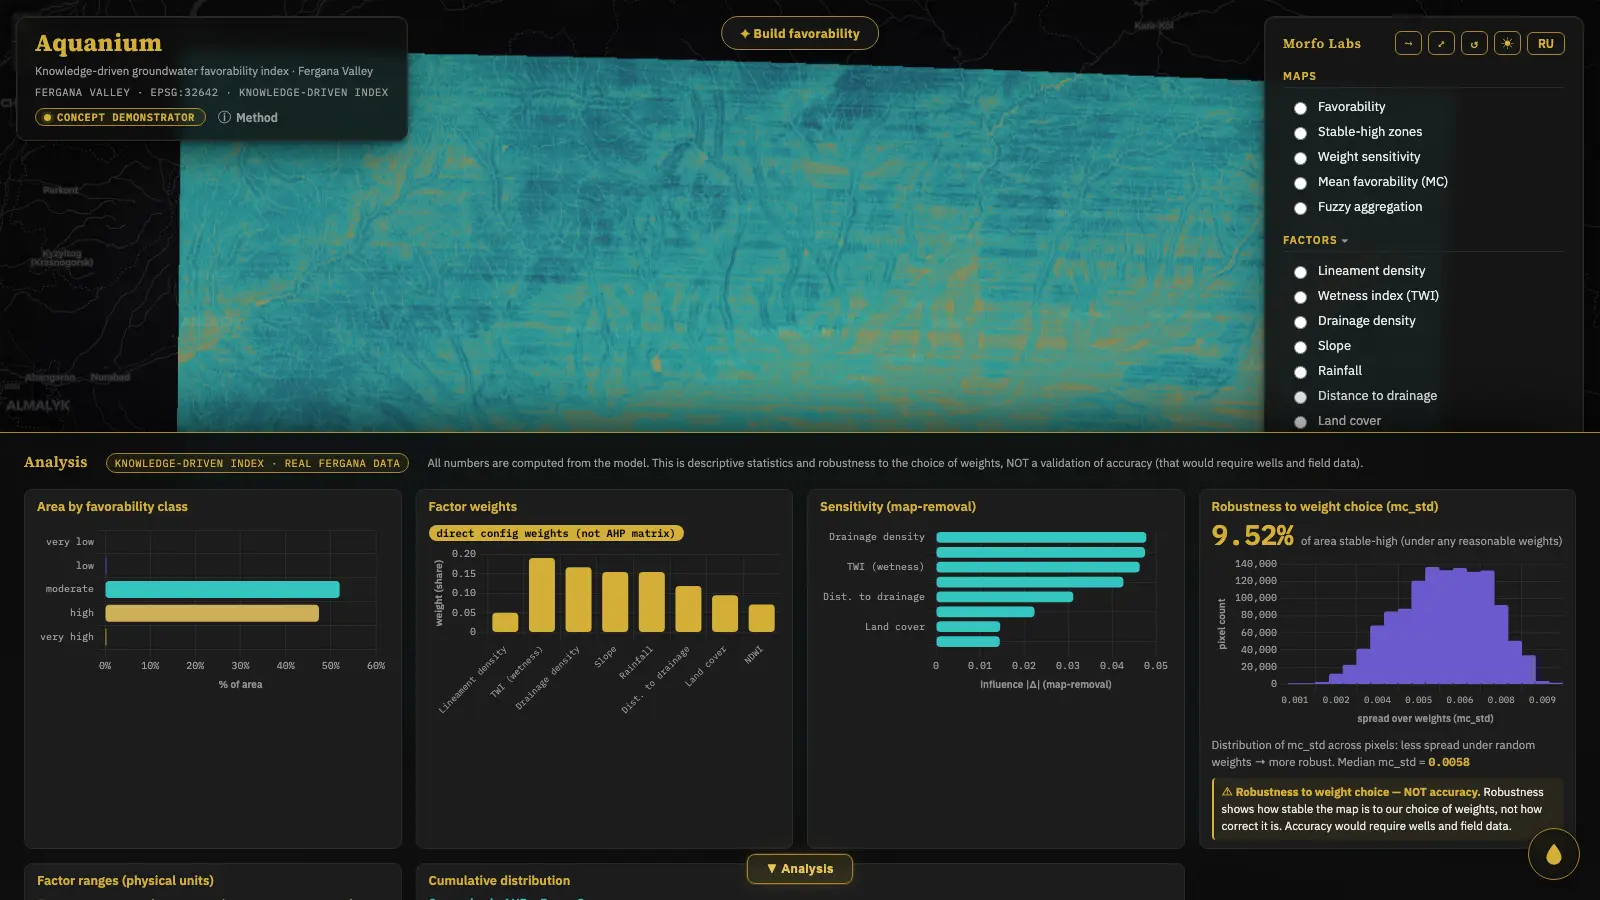
Interactive, on real data — explore the Fergana pilot yourself.
The live app runs the full pipeline on real open satellite data. Toggle the favorability map, the robustness layer, and all 8 factors; open the Analysis dashboard where every chart is computed from the actual rasters (area by class, factor weights, sensitivity, Monte-Carlo robustness, factor ranges); drag the weights in the Calibration panel; click anywhere to inspect the factor values at that point. Aqtrik, the in-app explainer, answers questions about the method and declines anything about “where to drill” or “how much water.”
-
Analysis dashboard -
Calibration -
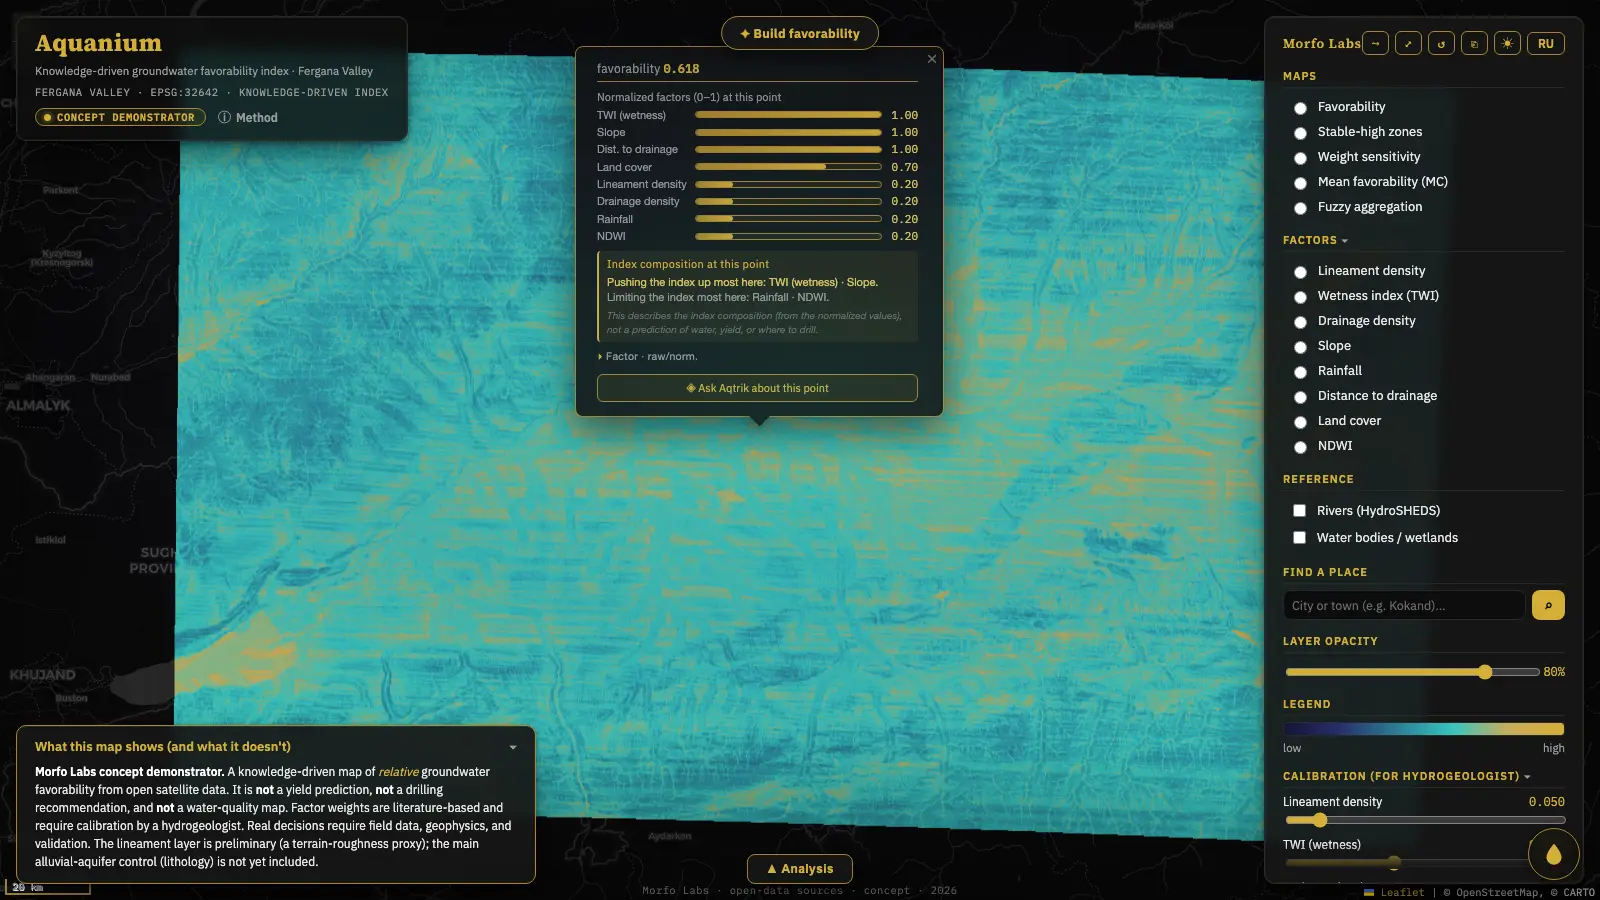
Point inspector -
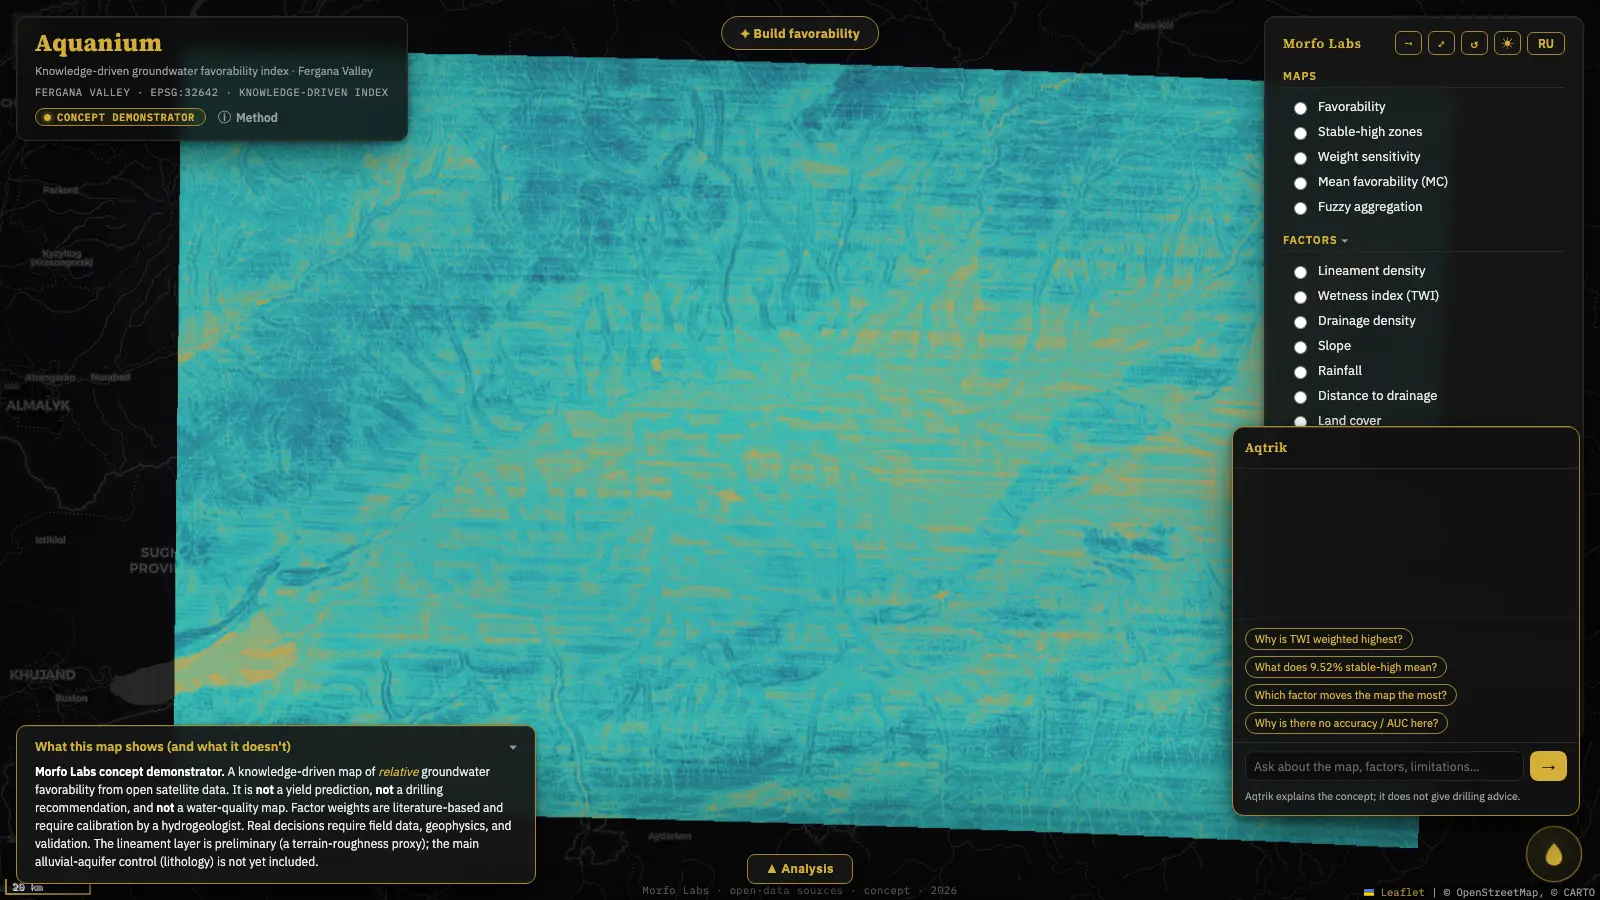
Aqtrik assistant -
Data provenance -
Factor-weights table
We show where we’re unsure
Robustness is not accuracy — and we never blur the difference.
A smooth colored heatmap can look more certain than it is. So Aquanium ships a robustness layer built from a Monte-Carlo run over the weights. It answers one specific question — how stable is the map to our choice of weights — and explicitly not how well it matches the reality underground. Confusing those two questions is the one thing we refuse to do.
The roadmap
From honest concept to a validated model — in the open.
-
1 · Concept demonstrator
NowAHP-weighted overlay + Monte-Carlo + Fuzzy Gamma on the Fergana pilot, topo-climatic factors, full web UI. No blockers — this is what you can use today.
-
2 · Data + hydrogeologist
NextBring in a hydrogeologist (advisor is enough to start) and, under NDA, regional lithology and historical wells from Goscomgeology / GIDROINGEO.
-
3 · Labeled training
PlannedA hydrogeologist cleans and labels the well inventory; factors become features; a statistical baseline (Frequency Ratio / Weights-of-Evidence) comes first.
-
4 · Validated supervised model
PlannedOnly with real labels: a supervised model with spatial cross-validation and an honest, leakage-aware accuracy assessment. This is where machine learning genuinely enters.
-
5 · Quality & monitoring
FutureWater-quality / freshness mapping (needs hydrochemistry) and storage-monitoring, plus reports for drillers and agencies.
Who is building this
Morfo Labs — a proven platform, applied to water.
Morfo Labs is a Tashkent-based team and an IT Park resident. Aquanium reuses roughly 70% of the infrastructure we already debugged on Mineralium (mineral-frontier mapping) — Earth Engine ingestion, export caching, and a FastAPI dark-theme web stack — and applies that proven pipeline to groundwater. The model part of Mineralium is deliberately left out here: with no labeled wells, there is nothing to train on yet, and we say so.
- Tashkent
- IT Park resident
- Built on the Mineralium platform
- 2026
Let’s build the next stage together
The map gets real when the data and the expertise arrive.
Aquanium’s concept stage is done. The next stage needs partners. We are looking for three things, through formal channels and under NDA.
- 01
Data
Regional lithology, historical wells (levels, mineralization), and rainfall calibration — via Goscomgeology, GIDROINGEO, Uzgidromet, and satellite products from Uzbekcosmos.
- 02
Expertise
A hydrogeologist — advisor or partner — to review the rank tables and weights and to anchor the work scientifically, alongside academic collaborators in the region.
- 03
A second pilot
Fergana is the active pilot built on real data. Samarkand exists as an early second demo region; with a partner’s data it can become a genuine second pilot.
Fergana is the only region built on real, validated open-data output today. Other regions are demonstrations or planned — we don’t overclaim them.